Google’s RDAs have new layouts for a better mobile experience

Want to know more about this upcoming update? Keep on reading

Google announced in the annual Marketing Live 2022 event that Responsive Display Ads (RDAs) are going to be enhanced towards a better mobile experience for advertisers and consumers, aka a mobile-first layout. According to Google, these changes give marketers more control over the ad’s visual appearance on mobile versions. 

What will be different about RDAs?

One of the main changes includes the option of a new portrait image:

  • Previously, the ad format required a square image, and Google filled in the gaps in the mobile version. 
  • Now, advertisers can control the ad’s appearance by allowing portrait images to display on mobile devices

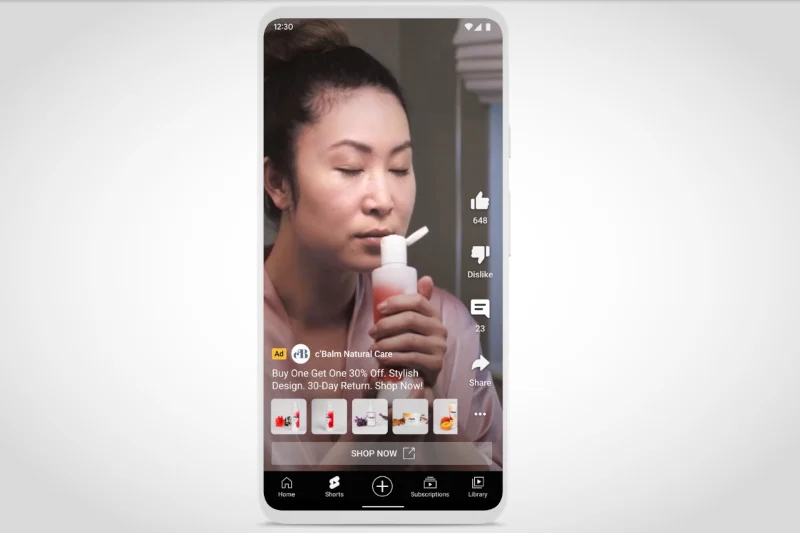
Additionally, Google now gives advertisers the option to use existing resources to create a vertical video for ad campaigns. This format uses machine learning to design and create engaging display ads. However, checking the end result before testing might be preferable, since auto-created videos might not be at your standard level. 

Do you think this is useful for visual creators? Let us know in the comments below.

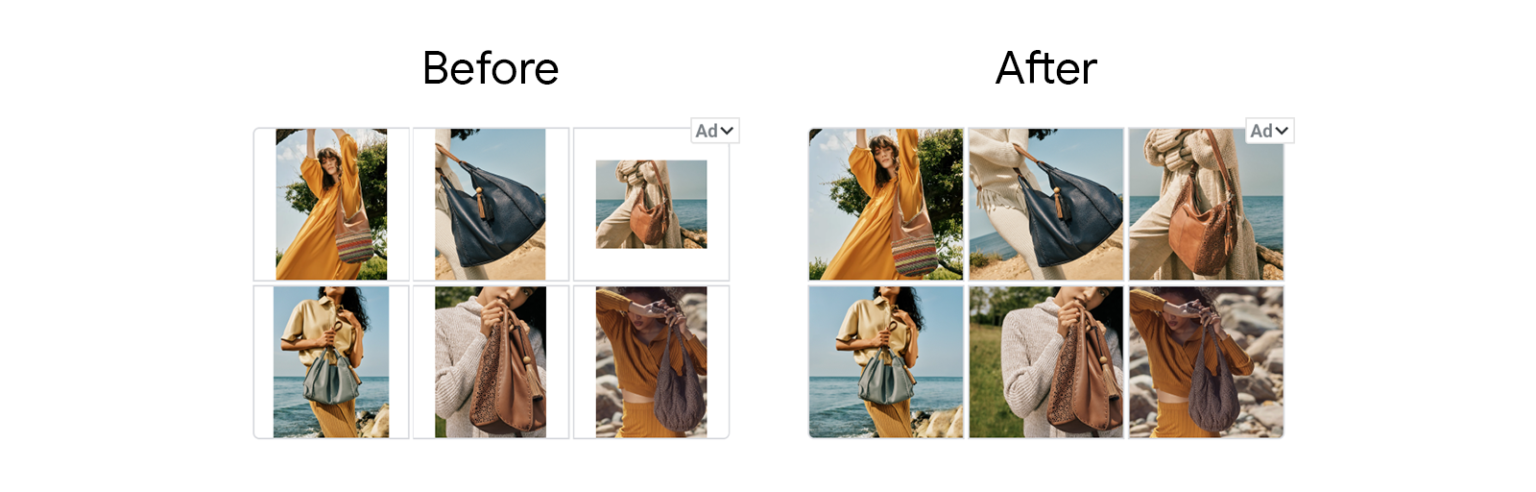
Another update to RDAs will make images fit in the available space, without needing to expand images. Let’s see an example:

Our Take

It is clear that RDAs are the dominant display ad format in Google’s platform. The possibility to adapt multiple size formats automatically for maximum coverage is a great benefit since traditional Display ads forced advertisers to design each and every image according to the size of the ad. However, RDAs are not quite cooked yet. As we see in Responsive Search ads (RSAs), Google allows advertisers to pin texts or images to guarantee it has a specific position, and this is a crucial feature we do not get to see in RDAs.

There should be more control over how ads are shown in different situations since not all advertisers are willing to have a full design team that builds hundreds of image variations according to each scenario. It would be a great addition to RDAs if Google launches more control tools that show how the ad is actually showing. It can’t be all black or white, some gray would be nice.   

Given that these additions show the importance of mobile usage nowadays, we are eager to see if any more ad formats are taken into account with more tools that give more power to advertisers.

As expected, we will keep you informed of any new updates launched in the near future. Stay tuned!

About Quantikal

Quantikal is a data-driven performance marketing agency based in Buenos Aires, Argentina. We help clients scale their business through profitable digital ad spending by constantly obsessing over clients’ key metrics. Quantikal’s experience working in diverse online companies in marketing roles including media buying allows us to provide solutions in the ever-demanding increase of marketing performance, doing more with less thus becoming a strategic partner.

#google #quantikal #rda #display #advertising #video #advertisers #performance

Main Announcements from Google Marketing Live 2022

Here’s everything you need to know about Google’s annual event and how it may impact your business

As you may imagine, we’ve been busy analyzing and investigating Google’s new announcements from Google Marketing Live 2022 event. However, YouTube Shorts is not the only feature that caught our eye. In this post, we’ll list the most important details about Google’s latest updates coming your way.

Updates in Video ads

Video ads coming to Discover

Google is considering the addition of short video ads to Discover. This is a huge announcement for video-focused advertisers since Discover features many videos in the feed with eye-catching images, so it could easily fit with the organic content.

Swipable shopping ads in Search 

Attention apparel brands: this new ad display will be available in Search and Performance Max campaigns, and will pair organic shopping results with your shopping ad, making it even more visual and more appealing for the shop-intent user. (imagen)

3D models of products with AR

Further enhancements also include the addition of augmented reality for shopping campaigns. Advertisers will be able to make 3D models of products appear directly on the results page, giving users a better experience and a better idea of what they’re purchasing. Even though there weren’t many details announced, we are very excited to see what Google has in stock for this new tech feature.  

Updates in automation tools

Performance Max updates

By the end of this year, Google announced updates coming to Performance Max campaigns, such as A/B testing, the ability to optimize in-store goals, experiment tools to help test potential lift, optimization score recommendations, and more performance data such as attribution, audience, and auction insights. This gives advertisers even more information to work with and more tools to enhance your campaign.

Enhancements in the Insights page

Focusing on first-party data, the new insights page includes new performance data, attribution, audience, and auction insights. This can help advertisers see how ads work together across Google’s interface, it can show how different user segments are controlling your campaign’s performance, and it can give more intel for budget optimization.

What do you make out of these new updates? Which one of them are you expecting the most? Let us know in the comments below.

We think Google’s latest announcements are promising, especially for advertisers that prefer a more visual approach. Quantikal will always be in favor of adding more tools for the advertiser to work with, and more control over crucial variables. 

Updates are expected to be fully out by the end of this year, so we are eager to see you try these out!  

As always, Quantikal will be digging deeper into these announcements and you’ll hear from us firsthand if any new features are coming your way. Stay tuned!

About Quantikal

Quantikal is a data-driven performance marketing agency based in Buenos Aires, Argentina. We help clients scale their business through profitable digital ad spending by constantly obsessing over clients’ key metrics. Quantikal’s experience working in diverse online companies in marketing roles including media buying allows us to provide solutions in the ever-demanding increase of marketing performance, doing more with less thus becoming a strategic partner.

How We Quadrupled Revenue in Less Than 7 Months

Here’s how to successfully spend in the right places.

With the right digital strategy, we were able to 4X the monthly sales from May 2021 to November 2021 while sacrificing only a fraction of return on ad spend (ROAS).  
Yes, you read correctly. If you want to know how we increased Tire Agent’s monthly non-brand revenues from Google Ads from $0.7M to $3.3M in 7 months, that’s an additional $2.6M in monthly revenues, keep on reading! 👇

Tire Agent is an e-commerce business that specializes in selling car tires and rims. They have a large selection of tires, rims, and wheels, and ship them anywhere in the U.S. for free. They carry over 60 brands of tires, including some top-tier brands like Michelin, Goodyear, and Bridgestone. Tire Agent makes sure that they’re offering the best rebates, coupons, specials, and discount codes on the internet, arranging payment plans that set them apart from any other online tire store.

The facts: although there was some initial traction in 2020, from January to May 2021 the company’s sales plateaued. Here’s when we stepped into the picture.  

What did we do to help? Everything but magic.

Since we started working with Tire Agent in May 2021, we immediately restructured and relaunched campaigns. When we stepped in, the client had limited budgets in overlapping campaigns. Using our proprietary methodology and experience, we figured out a way to untap growth in Search.

Following a Structured Process

With new search methodologies for expanding keywords, reordered ad groups, new match type pairing combined with fitting negative keywords, and focused extensions, we were able to make a difference in the details. 

In each step of the process, Quantikal provided monthly forecasted scenarios of different spend levels and ROAS estimates, allowing the client to make easier executive decisions on spend each month.

The key to figuring it out was a regular day-to-day follow-up and a dedicated process. 

We paid special attention to the search campaign that represents 50% of the brand’s investment: tire financing. Although this campaign was already set up when we arrived, it needed to be remodeled. We expanded the way of saying “financing” by adding rims and wheels, competitors, tire sizes, make-model-trim campaigns (MMT), and trying to find new ways of pausing keywords that weren’t working to focus investment on those that were working. 

Also, we tried out new negative keywords to build a more specific search, feeding into the list to see which other searches weren’t taken into consideration. 

Home runs don’t exist but consistent base hits do. 

Google’s keyword recommendations gave us some ideas to work with: “tires near me”. Based on this suggestion, the Quantikal team decided to look into the specifics of Tire Agent’s buyers and saw that location insertion was working better than the keyword insertion, so we launched a near-me location campaign. We targeted the best states and the best cities and built a geo-focused campaign so that users would be directed to the client when they searched for tires in their area, adding new audiences and specifying the search. 

After digging in deeper with the client’s methodology, we decided to build a campaign focused on the tires’ terrain (rocks, rain, snow, mud, etc.) trying out keywords that weren’t considered before. These two examples were the perfect trigger for us to realize that more terms were missing, so people were searching for more topic-related keywords and we weren’t taking advantage of that traffic flow. 

Extending Beyond Search

Another campaign type we worked with is display. It looked like a great field for traffic expansion. Through an increased number of new assets and creatives, not only generic but also related to product offers and rebates. We systematically tested assets, doubling down on the best-performing ones. After polishing and working on these campaigns, we had an average ROAS of 4, which looked positive considering that the average for non-brand was around 6.5.

At Quantikal, we also worked with discovery campaigns. Our expansion mainly came from testing multiple audiences and expanding reach, we used the learnings obtained from observing audiences in search campaigns and adding them into separate ad groups within discovery campaigns. During this period, we got to scale traffic by 10X while getting an average of 5 ROAS which is slightly below the search non-brand average of 6.5.

Hard Work Pays Off

The key to our client’s success was executing a true and tested process combined with close collaboration with our client’s industry knowledge.

Every revision and modification done in the Google Ads campaigns, as little as they may be, placed us one step closer to victory. Success came from consistency, testing, process, and attention to detail, that’s what makes the difference. And what a difference it can make if it increased our clients’ sales from $0.7M to $3.3M in just under 7 months.

Without fail and as expected, we will continue our hard work towards achieving the client’s ideal and we’ll keep you in the loop of our ongoing efforts. Stay tuned!

About Quantikal

Quantikal is a data-driven performance marketing agency based in Buenos Aires, Argentina. We help clients scale their business through profitable digital ad spending by constantly obsessing over clients’ key metrics. Quantikal’s experience working in diverse online companies in marketing roles including media buying allows us to provide solutions in the ever-demanding increase of marketing performance, doing more with less thus becoming a strategic partner.

Google Launches Free Deals Listings in Search Results

Google’s latest offering for e-commerce businesses is an option to list deals within search results. The tool is free for all merchants and takes advantage of the fact that today’s consumers are looking for ways to save money when they shop.

This launch may sound like a win for brands, but is it really? Google is almost universally beloved by consumers as a search platform, but as a merchant or advertiser, the story is a little bit different. Because Google’s focus is providing a positive search experience—and increasing its own revenue—it doesn’t always favor businesses on the other side of the equation.

With each new feature, it’s important to look beyond the initial praise to understand what the change really means for businesses. Here’s what we know about the free deals listing so far.

First, the deals will show up in the regular shopping tab, allowing consumers to monitor one single location for all relevant products. The difference is that the tab will now show product listings that are discounted, highlighting the savings with a green tag in the top left corner of the listing.

Google also announced that in October, it will use this same feature to highlight the best deals for Black Friday, Cyber Monday, and other significant shopping moments throughout the year.

Unfortunately, even with a discount loaded into your product listing, there’s no guarantee that Google will display your offer to consumers. Its algorithm will still take into account other factors like the product’s popularity, your site’s popularity, and how significant the discount is. This could mean that despite taking the time to update your listings, you won’t see any results from the change.

With all this in mind, here’s our take: Because the tool is completely free for merchants to use, there’s very little downside to running a few tests and monitoring how the deals tool performs for your products. If you already have shopping campaigns set up, setting up the deals feature for a few of your bestsellers should be a simple update. Just make sure to test a variety of products and discounts to understand what works best for your brand.

If you decide to go this route, now is a great time to get started. You may still be able to take advantage of early adopter benefits before the tool is widely used by your competitors. You’ll also have time to learn how to optimize your use of the tool before we hit holiday shopping booms. At that point, you’ll be in a prime position to capitalize on your (hopefully) increased return.

We’re really hoping this tool gains traction and Google delivers on its promise, but we haven’t forgotten how Google’s first organic search tool was affected (and organic results were diluted) when it expanded from three paid search results to four.

So, will this remain a free deal listing, or will it just be an experiment for a future paid extension? Only time will tell. Drop a comment bellow on your thoughts.

In the meantime, since it’s free to implement, try it out and see what you find. We’d love to hear from you if you have any interesting takeaways from your experiments. As always, we’ll continue to monitor the landscape and report back with any updates or changes over time.

Keywords

Never Ever Use These Match Types Together

To the tune of Taylor Swift’s song.

It has been some time that I wanted to sit down and write this post. I cringe every time I see incorrect use match type in a client’s account.

As of today you can choose from four type of match types:

  • Exact
  • Broad Modified Match (BMM)
  • Generic broad
  • Phrase

Care to guess which ones are ok and which are not?

Explaining this concept to my clients, I always like to do a small exercise of the imagination. It goes somewhat like this: imagine a car. This car is similar to any other car but the difference is each time you press on the gas pedal, the windshield wipers begin working. Every time you hit on the breaks the right doors open. Each time you signal left or right, your car seat reclines. Now imagine trying to drive this imaginary car on your daily commute from home to work. Yes, it will drive you crazy!

Managing and trying to optimize an account with most of the keywords are generic broad or phrase match is like driving that car.

So now you know that Exact and BMM match types are ok, the other two, not so much.

So the begging questions is why?

There are two major concepts on selecting keyword match type, coverage and linear independence.

Coverage is the ability of having a small set of keywords that cover an important amount of user search queries of the interested category you compete in. Coverage is lowest with Exact match as the probability to match a certain user search query is lower than other types of matches. In the other extreme, the Generic Broad has the highest coverage. However, this high coverage comes at a price. A very steep price indeed as you will see below, the price is low independence.

Linear independence is the ability for one keyword of behaving independently of other keywords in the same account. We can think of it as low interdependence or low cannibalization of searches between each keyword. For those of you that remember some algebra, it is similar to the concept of avoiding the co-linearity of vectors. Now, keywords and semantic objects are not vectors. However, organizing an account as clean as possible is the first step to been able to optimize the account in the future through keyword bidding.

Why then do broad generic keywords have low independence? And why should it matter? There two main problems with broad generic keywords:

1) Not all the keywords needed to be present in the query to activate the match. What we call the partial match.

2) Google allows the use of synonyms on broad generic.

This generates many search queries that may not be aligned to your business offerings or there is a lost opportunity of handling a generic keyword as a mixed bag of intentions. Let’s take one example from the auto industry. One might say that the adjective “used” car and “pre-owned” car means the same and Google might interpret them as synonyms. However, I can tell you from experience that keywords +used +car and +pre +owned +car do not behave the same. For a used car classifieds site, generally, the “pre-owned” term usually has a higher conversion rate. Because of this conversion rate difference, it is important to have these terms separated using BMM structure instead of a generic match type. This will allow to bid separately for each term optimizing the account better.

So remember, every time you use a generic broad match a SEM fairy dies. Joking aside, I recommend using a mix of 5%/10% exact match keywords and 90%/95% BMM keywords.

Think about building a good structure and keyword base for account optimization through keyword bidding.

Happy bidding.

Google-position

What Google doesn’t want you to know about average position

An oldie but good one. Originally published in 2015.

The average position myth

A common phrase that I have heard about average position is the closer to the top of the page the better. I have even heard that the 1st ad position should be coveted by digital marketers specially on the branding benefits. The proliferation of this myth leaves me baffled.

I wanted to shed some light and some humble evidence to contradict this point. That first position isn’t the best position SERP for a performance oriented account. Insteat a target position between 2 and 3 stands what I would call a performance “sweet-spot”. 

Average CTR vs. Average Position

Above shows a graph of accumulated information on a high volume (clicks & conversions) ad group. We will later see it is representative of other ad groups that show similar conclusions. The graph was generated with information of 12 month window. Each of the ad groups analyzed were composed of highly homogeneous keywords and high percentage of ad group traffic was consolidated in a few exact terms.

The graph was generated aggregating daily reports by average position cluster. Within the analyzed time period competitive structure was stable and no major changes were made to the ad group just bidding CPC price updates. 

The X-axis represents the average position cluster, the Y-axis on the left shows average CTR.

Nothing mind-blowing here, CTR generally decrease with an increase of average position. Now (below) we add an overlay of data points with their average CPC (right Y-axis)

Average CPC vs. Average Position

Average CPC declines as well, the closer the position to 1.0 the more expensive it is. Again, no major news.

From this point on, it gets more interesting, let’s dive deeper on the CTR and CPC curves. 

CTR Linear Fit

In this example a linear regression for the CTR curve offers a good fit (R^2=71%)

CPC Exponential Fit

However, the CPC curve has a better fit with an exponential curve (R^2 = 86%). This type of curve shows that CPC has an accelerated decay or accelerated increase, depending if you move left or right within the graph.. 

Finding the sweet-spot

Considering that the conversion rate is stable within the same ad group and independent of average position, then CPC and Cost Per Acquisition (CPA) go hand in hand. 

We can see an area where CTR is stable and CPC has local minimum, behold, our sweet-spot. Let’s call this area the Efficient Position Area (EPA, environmental pun intended). 

As we can see from the graph, as we move to the left of the area, CTR does not increase much however average CPC (also conversion cost) increases dramatically without any significant gain in volume. On the other side, moving to the right, CTR has a significant drop as we get close and cross the 3.0 average position barrier. This decline in click volume is seen across many ad groups. I can be related to going from top ads to sidebar ads in the SERPs.

Conclusion

Optimizing bids taking into account ad position within efficient area can generate savings that can be used to invest in other keywords/adgroups lowering overall CPA of global account. 

So try making this analytic exercise with your own adwords account, let me know through comments if you find similar findings.