Learn about this “new tool” for the automotive marketing industry.
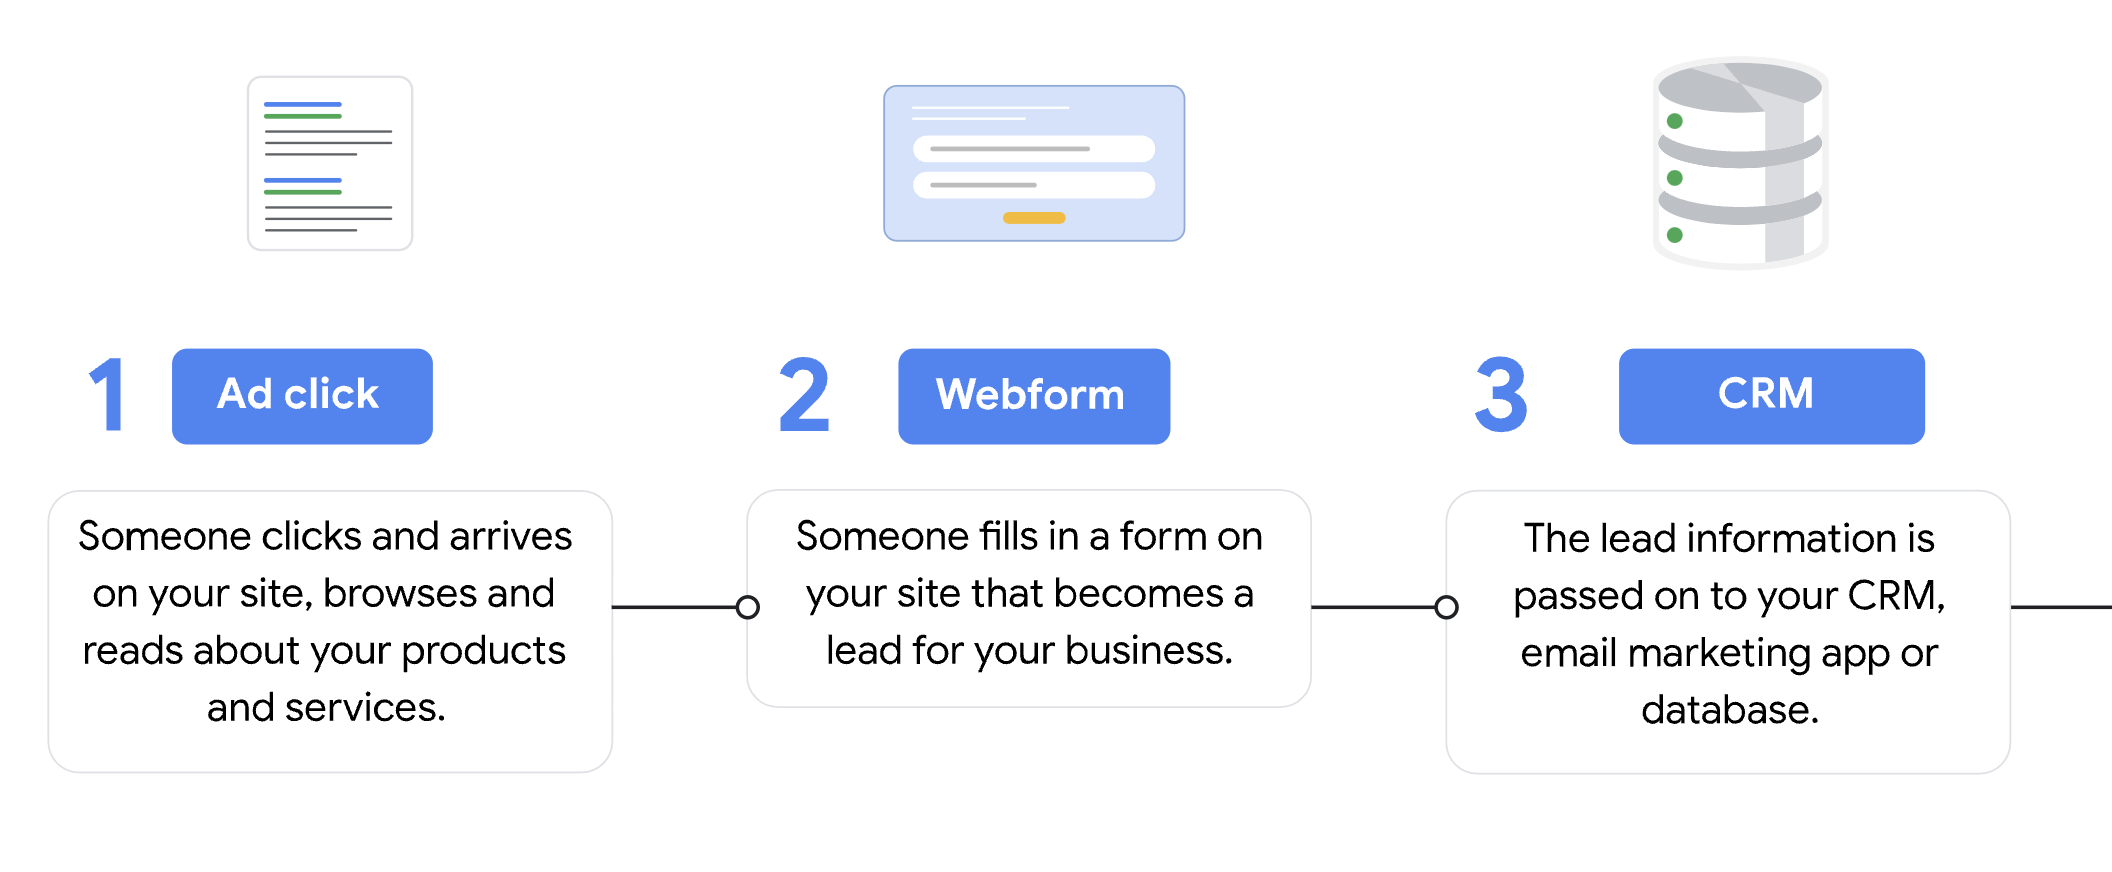
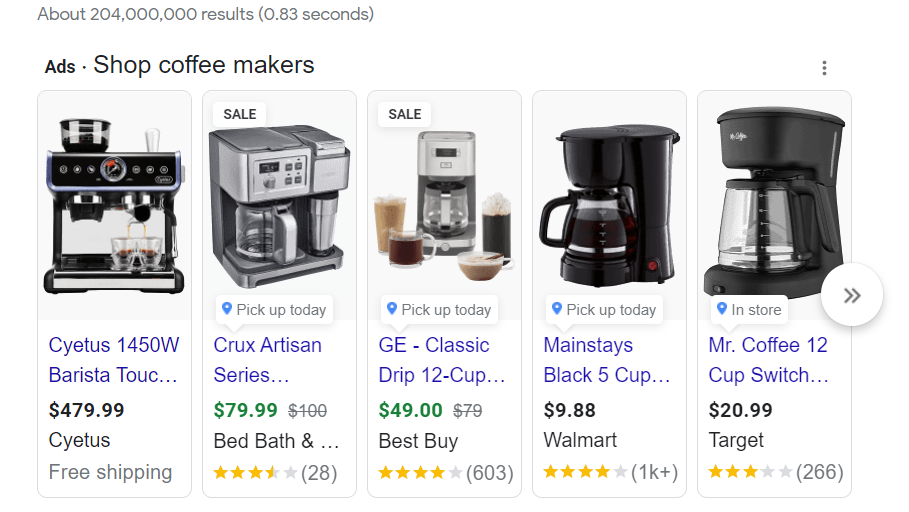
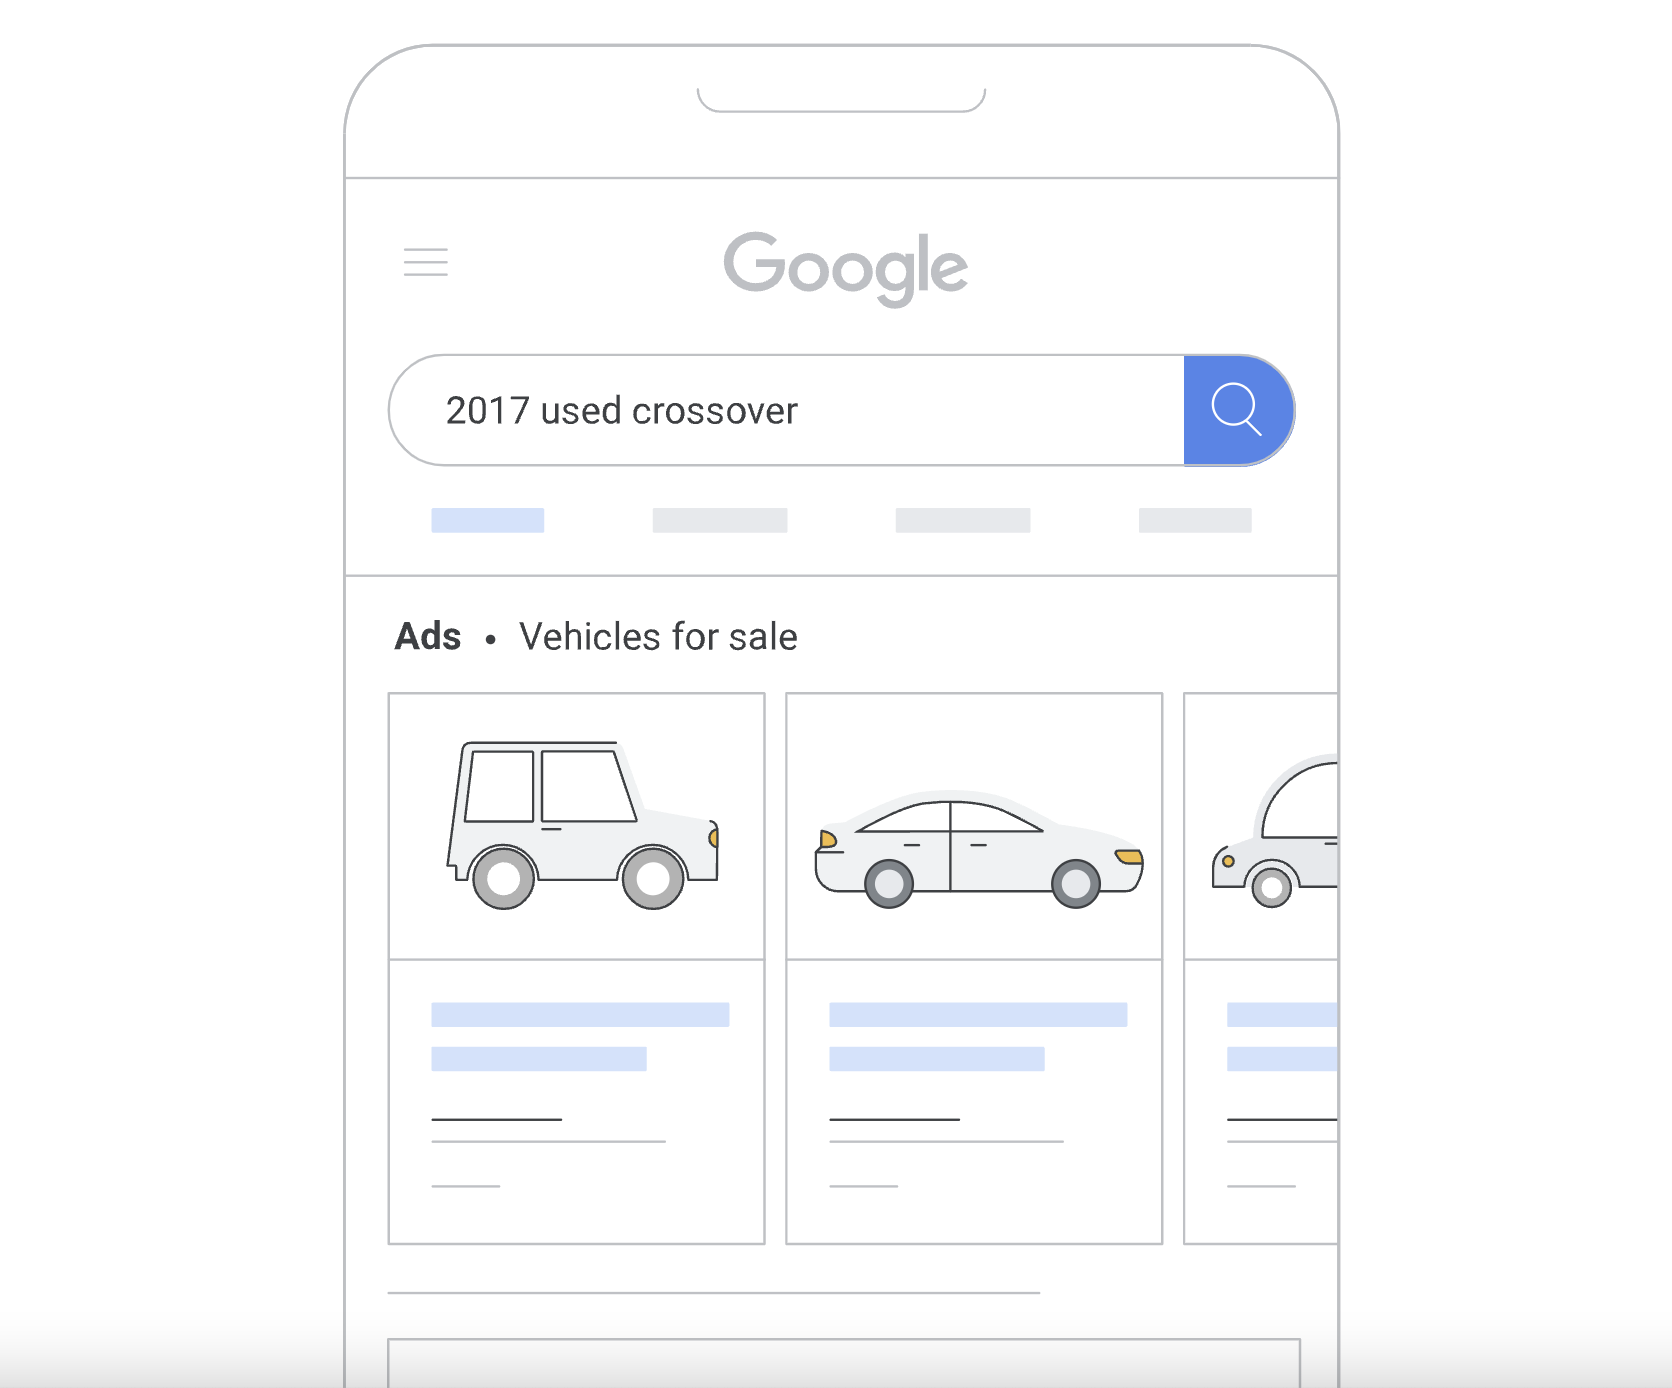
Google gives advertisers a new ad format that shows vehicles to purchase nearby. Now, when a user searches “cars for sale”, they see options to either purchase or get the vehicle delivered.
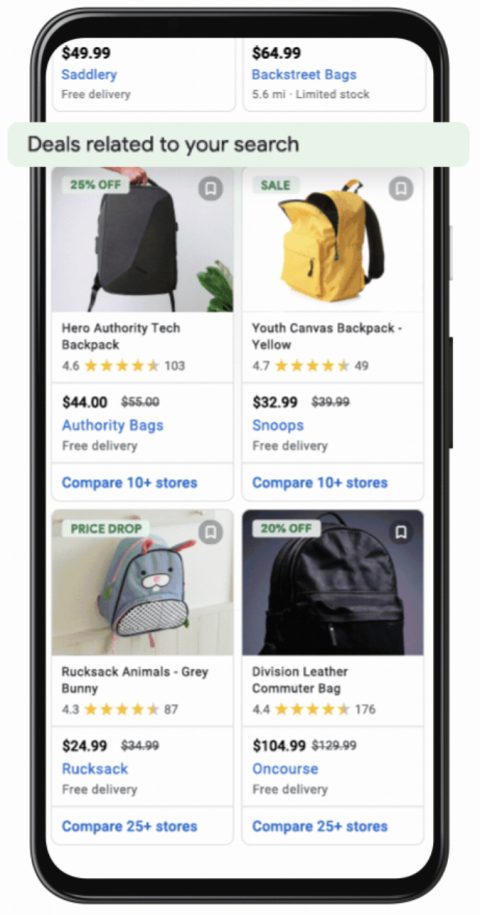
The ad format shows specific information about the product, including:
- Location
- Make
- Model
- Price
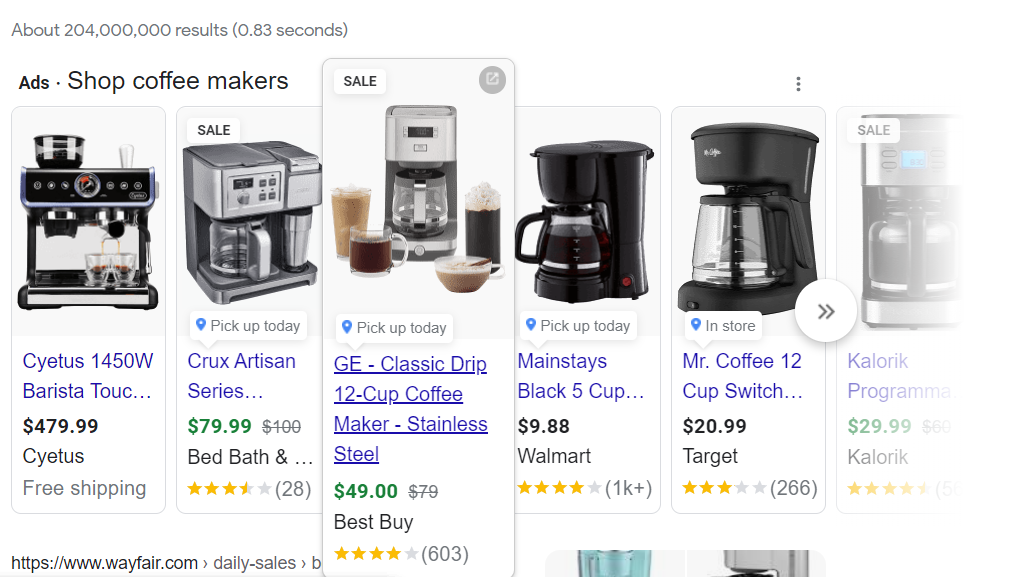
When the user clicks the ad, it redirects to the vehicle item page on the dealer’s website with the contact information.
Where does it apply?
The first step is to create an inventory feed, which needs to be connected to Google Merchant Center and Google Business Profile. However, vehicle ads can’t run on standard Shopping campaigns. Smart Shopping is a requirement.
Vehicle ads are not allowed for private sellers, individual sellers, or auto brokers. These are only allowed for non-commercial passenger vehicles, such as cars, SUVs, etc.
The vehicle ads format does not show automatically in your account, so advertisers have to contact Google if interested.
The main benefits of vehicle ads
Advertisers that have beta-tested this new feature seem to point out that there was a 25% increase in conversions via vehicle ads before it rolled out to the public. The expectation being user having more detailed information before clicking on an ad will create an expected higher conversion rate later on website.
Online consumer behavior transformed in the past two years because of the pandemic, so it is smart to consider that users are making vehicle purchases online as well.
A Google study finds that 89% of new car buyers researched their vehicle online.
Our Take
With Google’s new vehicle ads, marketers can keep up with this new modality, stepping in front of online car buyers with the right information.
However, we’ve already seen this move from Google in the past. The tech company wanted to override car marketplaces and create its own platform, which would make advertisers pay Google directly for site traffic.
The challenge for Google was that car marketplaces know how usears search for vehicles, and can help users narrow down by make, model, trim, etc., in order to simplify user experience. This is not easy to replicate and not easy to compete with, even as a huge tech company. Somehow, in the past, Google never launched its platform.
It should be interesting to see why this could turn out differently now than in the past. The truth is, Shopping ads weren’t so developed back then, so that could be an important fact to consider.
What do you think? Google can now compete with marketplaces as equals? Let us know in the comments below.
As always, Quantikal will be keeping tabs on this new ad format and we’ll get back to you with more updates. Stay tuned!
About Quantikal
Quantikal is a data-driven performance marketing agency based in Buenos Aires, Argentina. We help clients scale their business through profitable digital ad spending by constantly obsessing over clients’ key metrics. Quantikal’s experience working in diverse online companies in marketing roles including media buying allows us to provide solutions in the ever-demanding increase of marketing performance, doing more with less thus becoming a strategic partner.